
INTRODUCTION
Metabolic syndrome (MS) is a public health concern defined as a cluster of metabolic abnormalities that increase the risk of chronic diseases and augmented cardiovascular risk1. Its diagnosis is established when at least three of the following are present: abdominal obesity, hypertriglyceridemia, low levels of cholesterol, high-density lipoprotein (HDL), hypertension, and impaired fasting glucose2.
In Mexico, the rotating undergraduate medical internship (RUMI) is a fundamental stage of the Medical Career, combining theoretical and practical training as a prerequisite for medical licensure3. However, the working conditions of undergraduate medical interns (UMIs) are not fully regulated, often involving extended shifts, sleep deprivation, poor-quality nutrition, and high levels of psychological stress, conditions that may lead interns to adopt unhealthy behaviors, including increased alcohol and tobacco consumption4, conducting to MS development by promoting insulin resistance and a chronic proinflammatory state5.
While the prevalence of MS in the Mexican adult population has been estimated in approximately 41%6, its incidence and impact in medical trainees (particularly UMIs), remain poorly studied with most existing research focused on medical students or residents, leaving a gap in understanding the specific risks faced during the internship year.
This study aimed to determine the prevalence of MS among UMIs at a university hospital in Puebla, Mexico, and evaluate changes in its components: body weight, body mass index (BMI), blood pressure (BP), fasting glucose, glycated hemoglobin (HbA1c), triglycerides (TG), total cholesterol (CHOL) and its fractions HDL, low-density lipoprotein (LDL), and very-low-density lipoprotein (VLDL), before starting and after completing the RUMI.
MATERIALS AND METHODS
Ethical considerations
This study was approved by the Research Ethics Committee of the Faculty of Medicine of the “Benemérita Universidad Autónoma de Puebla.” Record No. Book 3, 037 sheet, 1066. Written informed consent was obtained from all participants before enrollment and before each blood draw. The study was classified as minimal risk (risk level I).
Study design and setting
We conducted an observational, longitudinal, prospective cohort study at a university hospital in Puebla between July 2023 and June 2024, attending to the STROBE guidelines7.
Population and sample
Participation was voluntary, and invitation was extended to all interns assigned to the hospital during the study period. Of 40 eligible interns, 34 consented and 32 met eligibility after exclusions (1 hemolyzed sample and 1 inadequate fasting). Five did not attend the follow-up, leaving a final cohort of 27 interns for longitudinal analyses (Supplementary figure 1).
Variables
Direct measured variables included weight, BMI, systolic BP (SBP), diastolic BP (DBP), fasting glucose, HbA1c, CHOL, TG, HDL, LDL, and VLDL. Independent variables included age, sex, average daily sleep hours (DSH), weekly exercise hours (WEH), alcohol use, smoking, family history of metabolic disease, and perceived stress measured using the Perceived Stress Scale (PSS)-14 scale post-RUMI. Secondary variables were prediabetes assessed through ADA 2024 criteria (fasting glucose 100-125 mg/dL and/or HbA1c 5.7-6.4%): BMI categories (underweight < 18.5; normal 18.5-24.9; overweight 25.0-29.9; obesity ≥ 30 kg/m2; and MS diagnosed by modified ATP III criteria (HDL < 40 mg/dL in men or < 50 mg/dL in women, BP ≥130/85 mmHg, fasting glucose ≥100 mg/dL and/or HbA1c ≥ 5.7% and TG ≥150 mg/dL, BMI ≥ 25 kg/m²).
Data collection and procedures
Weight, height, BMI, and BP were assessed through routine clinical exploration. Venous blood was drawn after ≥12 h fasting, glucose was measured by a colorimetric enzymatic method (FUJIFILM DRICHEM NX500i), HbA1c with BioHermes A1C EZ 2.0; lipid fractions (HDL, LDL, VLDL, CHOL, and TG) were assayed by standard enzymatic methods at the hospital clinical laboratory. Stress was assessed with the PSS-14 validated for Mexican populations.
Statistical analysis
Analyses were performed in Jamovi v2.6.25 and Python v3.11 using: pandas for data handling, numpy for numerical operations, scipy.stats for inference, and matplotlib for figures. Confidence level was 95% and all tests were two-sided (α = 0.05). Continuous variables were summarized with mean, median, standard deviation, variance, interquartile range (IQR), and range; categorical variables with counts and percentages. All paired analyses used complete pairs (n = 27).
For each continuous outcome (weight, BMI, SBP, DBP, fasting glucose, HbA1c, HDL, LDL-C, VLDL, CHOL, TG, and MS criteria count), we assessed normality of within-subject differences using Shapiro-Wilk test. Wilcoxon signed-rank with Hodges-Lehmann (HL) median difference with 95% confidence interval (CI) was performed. For non-parametric effect size, we computed the rank-biserial correlation, and additionally r = Z/√n from the Wilcoxon normal approximation and represented the results in violin plots. When the distribution was approximately normal, we ran paired t-tests, reporting the mean change with 95% CI and Cohen’s dz. For binary endpoints, we estimated the within-subject prevalence at both time points and compared pre versus post using McNemar’s test. We report the asymptotic χ2 (df = 1) and the two-sided exact binomial p-value and used Stacked bar charts to represent them.
Associations among variables were explored cross-sectionally at each time point through Spearman’s rank correlation and plotted these correlation matrices as heatmaps (blue for negative, red for positive), annotating statistical significance with * (p < 0.05), ** (p < 0.01), and *** (p < 0.001). All inferential outputs were cross-validated between Jamovi and Python to ensure consistency.
RESULTS
Baseline characteristics
27 interns were evaluated. Mean age was 24.7 ± 1.4 years; 55.6% were female and 44.4% male. At baseline, median BMI was 22.9 kg/m2 (IQR 20.5-25.9), with 37.0% meeting BMI ≥ 25; median SBP/DBP were 114/72 mmHg (IQR SBP 109-118; DBP 68-77), with 0% meeting BP ≥ 130/85. Glycemic markers were low-normal (fasting glucose 90 mg/dL [85-93]; HbA1c 4.8% [4.6-5.0]), and a small proportion met prediabetes (3.7%). Lipids showed HDL 40 mg/dL (32.5-49.5), LDL-cholesterol 103.8 mg/dL (92.4-119.1), CHOL 165 mg/dL (149-183), TG 101 mg/dL (73-120.5), and VLDL 20.2 mg/dL (14.6-24.1); 11.1% had TG ≥ 150 mg/dL and 59.3% had low HDL. The MS prevalence at baseline was 3.7%, with a median of 1 MS criterion per participant (IQR 1-1) (Table 1).
Table 1. Baseline characteristics
| Variable | Overall n = 27 (100%) |
|---|---|
| Gender, n (%) | |
| Female | 15 (55.6) |
| Male | 12 (44.4) |
| Age (years) | |
| Mean (SD) | 24.7 (1.4) |
| Range | 22.0-28.0 |
| Weight (Pre, kg) | |
| Mean (SD) | 62.4 (12.2) |
| Range | 35.8-88.5 |
| Height (Pre, m) | |
| Mean (SD) | 1.6 (0.1) |
| Range | 1.4-1.8 |
| BMI (Pre, kg/m2) | |
| Mean (SD) | 22.9 (3.4) |
| Range | 16.1-28.8 |
| BMI category (Pre), n (%) | |
| Normal weight (N) | 15 (55.6) |
| Overweight/Obesity (OW) | 10 (37.0) |
| Underweight (U) | 2 (7.4) |
| Personal history of MD, n (%) | |
| No | 21 (77.8) |
| Yes | 6 (22.2) |
| Family history of MD, n (%) | |
| No | 17 (63.0) |
| Yes | 10 (37.0) |
| Smoking (Pre), n (%) | |
| No | 25 (92.6) |
| Yes | 2 (7.4) |
| Alcohol use (Pre), n (%) | |
| No | 19 (70.4) |
| Yes | 8 (29.6) |
| Weekly exercise hours, WEH (Pre, hours/week) | |
| Mean (SD) | 2.9 (2.1) |
| Range | 0.0-5.0 |
| Daily sleep hours, DSH (Pre, h/day) | |
| Mean (SD) | 5.5 (0.8) |
| Range | 4.0-7.0 |
| Systolic blood pressure, SBP (Pre, mmHg) | |
| Mean (SD) | 112.9 (7.1) |
| Range | 100.0-126.0 |
| Diastolic blood pressure, DBP (Pre, mmHg) | |
| Mean (SD) | 72.1 (6.8) |
| Range | 56.0-82.0 |
| Fasting glucose (Pre, mg/dL) | |
| Mean (SD) | 88.1 (7.8) |
| Range | 72.0-102.0 |
| HbA1c (Pre), n (%) | |
| Mean (SD) | 4.8 (0.3) |
| Range | 4.2-5.4 |
| Triglycerides, TG (Pre, mg/dL) | |
| Mean (SD) | 101.1 (38.2) |
| Range | 25.0-191.0 |
| Total cholesterol, CHOL (Pre, mg/dL) | |
| Mean (SD) | 166.3 (24.0) |
| Range | 124.0-229.0 |
| LDL-cholesterol, LDL (Pre, mg/dL) | |
| Mean (SD) | 105.7 (18.8) |
| Range | 74.8-150.4 |
| HDL-cholesterol, HDL (Pre, mg/dL) | |
| Mean (SD) | 40.4 (9.8) |
| Range | 23.0-61.0 |
| VLDL (mg/dL) | |
| Mean (SD) | 20.2 (7.6) |
| Range | 5.0-38.2 |
| TG/HDL ratio (Pre) | |
| Mean (SD) | 2.7 (1.4) |
| Range | 0.6-6.8 |
| BMI ≥ 25 kg/m2 (Pre), n (%) | |
| No | 17 (63.0) |
| Yes | 10 (37.0) |
| BP ≥ 130/85 mmHg (Pre), n (%) | |
| No | 27 (100.0) |
| Prediabetes (Pre), n (%) | |
| No | 26 (96.3) |
| Yes | 1 (3.7) |
| TG ≥ 150 mg/dL (Pre), n (%) | |
| No | 24 (88.9) |
| Yes | 3 (11.1) |
| Low HDL-C (Pre), n (%) | |
| No | 11 (40.7) |
| Yes | 16 (59.3) |
| MS criteria count (Pre, 0-5) | |
| Mean (SD) | 1.1 (0.7) |
| Range | 0.0-3.0 |
| Metabolic syndrome, MS (Pre), n (%) | |
| No | 26 (96.3) |
| Yes | 1 (3.7) |
|
Baseline characteristics of undergraduate medical (n = 27). Continuous variables are shown as mean (standard deviation) and range; categorical variables as n (%). SD: standard deviation; BMI: body mass index; MD: metabolic disease (diabetes, dyslipidemia, hypertension or cardiovascular disease reported); WEH: weekly exercise hours; DSH: daily sleep hours; SBP: systolic blood pressure; DBP: diastolic blood pressure; TG: triglycerides; CHOL: total cholesterol; LDL: low-density lipoprotein cholesterol; HDL: high-density lipoprotein cholesterol; VLDL: very-low-density lipoprotein cholesterol; MS: metabolic syndrome. Low HDL-C, TG ≥ 150 mg/dL, BMI ≥ 25 kg/m² and prediabetes are shown according to standard cut-offs used for MS components. |
|
Paired tests
Given the small sample size, Wilcoxon signed-rank tests were used regardless of distributional assumptions (Fig. 1A–L). We found a significant increase post-RUMI in: Weight (HL Δ = 4.6 kg [–1.62-9.48]; p < 0.001); BMI (HL Δ = 1.68 kg/m2 [-0.61 to 3.81]; p < 0.001); SBP (HL Δ = 2.0 mmHg [-2.5-16.5]; p = 0.002); DBP (HL Δ = 2.0 mmHg [-1.0-14.0]; p < 0.001); Fasting glucose (HL Δ = 5.0 mg/dL [-1.29-13.0]; p < 0.001); HbA1c (HL Δ = 0.25 % [-0.25-0.50]; p = 0.001); CHOL (HL Δ = 21.0 mg/dL [-35.66-65.65]; p = 0.021); HDL (HL Δ = 7.5 mg/dL [-8.79-29.0]; p = 0.019); and MS criteria count (HL Δ = 0.5 [-0.79-2.0]; p = 0.018). We did not find a clear change in: TG (HL Δ = 17.0 mg/dL [-77.15 to 214.58]; p = 0.301); LDL (HL Δ = 5.85 mg/dL [-34.78-38.52]; p = 0.361); nor VLDL (HL Δ = 2.5 mg/dL [-10.48-40.95]; p = 0.194).
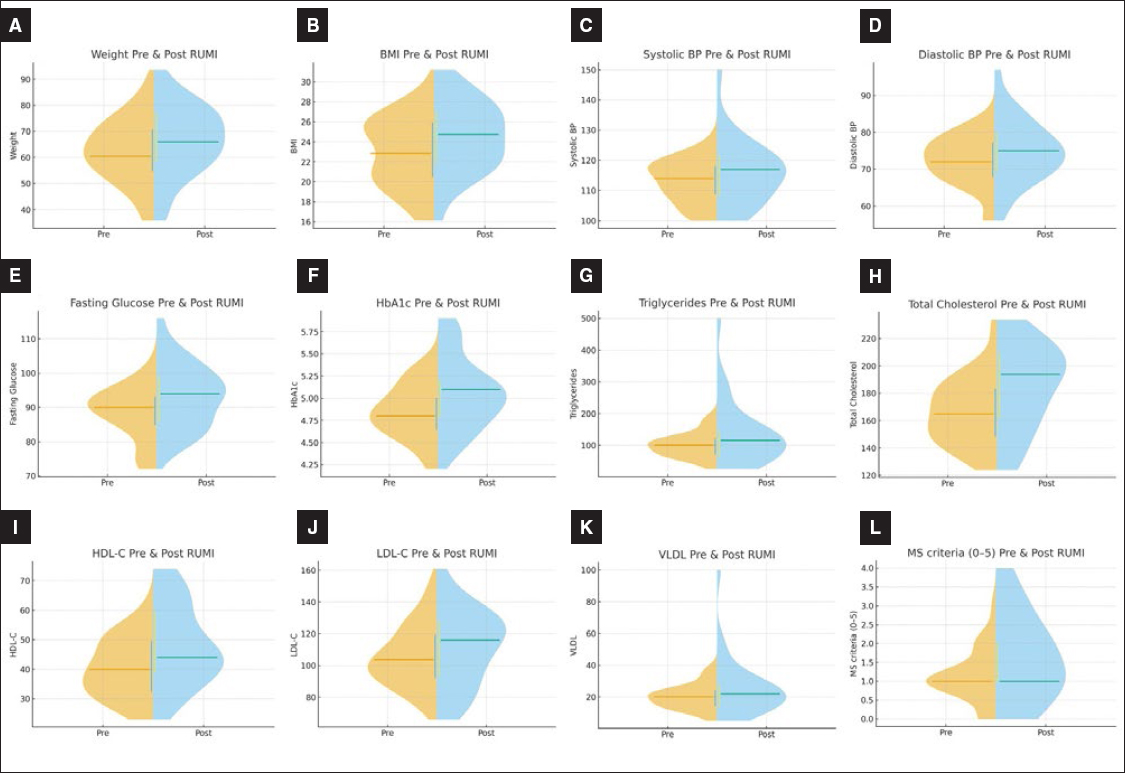
Figure 1. Violin plots of continuous outcomes (Pre- and Post-rotating undergraduate medical internship). A: weight, B: body mass index, C: systolic blood pressure, D: diastolic blood pressure, E: fasting glucose, F: glycated hemoglobin, G: triglycerides, H: total cholesterol, I: high-density lipoprotein cholesterol, J: low-density lipoprotein-cholesterol, K: very-low-density lipoprotein cholesterol, and L: number of metabolic syndrome criteria met (0-5). Each violin shows the kernel density; the central line denotes the median (Interquartile range shown as the thick segment).
We also performed paired t-test for outcomes that distributed approximately normal (assessed by Shapiro-Wilk test) to confirm these findings (Supplementary table 1).
Categorical changes
To evaluate if these increases clinically impacted the interns, we performed McNemar’s tests to compare the proportion of interns that met each MS diagnosis criteria (Fig. 2A–F). There was minimal change in BMI ≥ 25 (χ2 = 0.33, p = 0.564), unclear increase in BP ≥130/85 (χ2 = 4.00, p = 0.045), modest increase in TG ≥150 mg/dL (χ² = 0.67, p = 0.414), and small decrease of HDL (χ2 = 0.69, p = 0.405), however a marked increase in Prediabetes (χ2 = 9.00, p = 0.0027), and MS (χ2 = 5.00, p = 0.025) were found. Exact p-values corroborated this since prediabetes reached significance (p = 0.0039) and MS was marginally significant (p = 0.06).
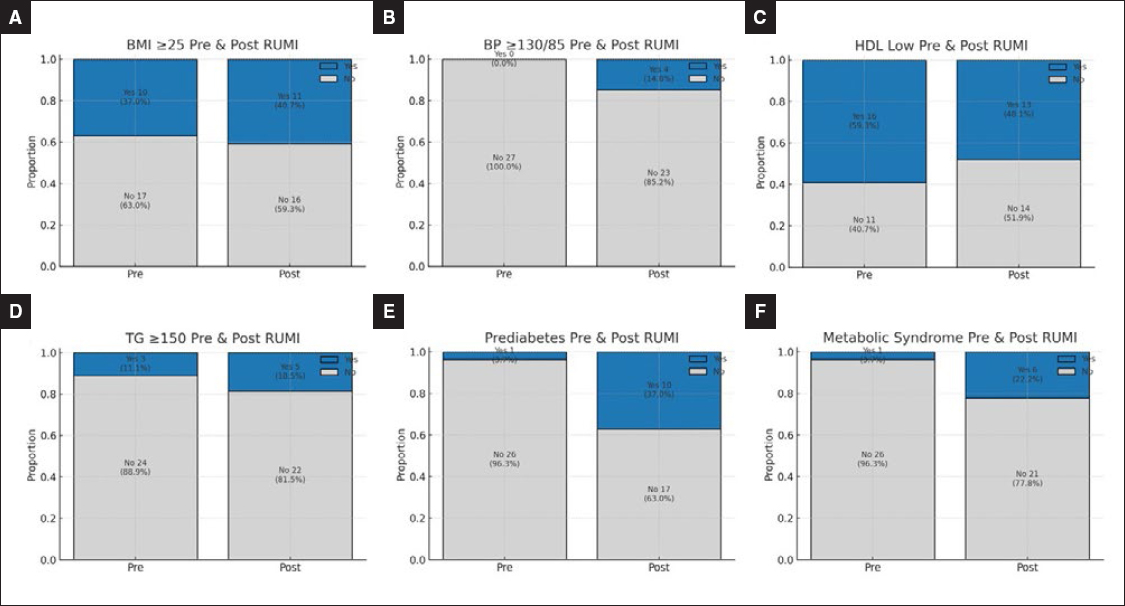
Figure 2. Stacked bar charts of metabolic syndrome components (Pre- and Post-rotating undergraduate medical internship). A: body mass index ≥ 25 kg/m2, B: blood pressure ≥ 130/85 mmHg, C: low high-density lipoprotein (sex-specific threshold), D: triglycerides ≥ 150 mg/dL, E: prediabetes (fasting glucose 100-125 mg/dL and/or glycated hemoglobin 5.7-6.4%), and F: metabolic syndrome (≥ 3/5 criteria).
Outcomes correlation
We performed Spearman correlations between risk factors and outcomes at both time points, pre- and post-RUMI (Fig. 3A–B), finding expected correlations between lipids (VLDL-TG, CHOL-LDL, CHOL-TG), and BP components (SBP-DBP), as well as other clinically significant.
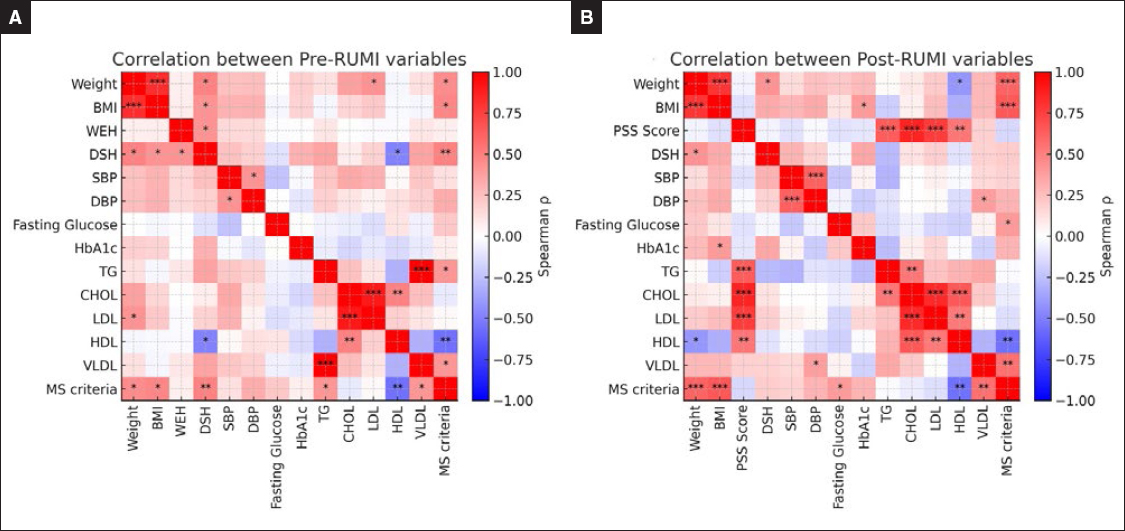
Figure 3. Spearman correlation heatmaps A: pre-RUMI, panel; B: post-RUMI, panel. Color scale indicates correlation magnitude and direction (from −1 to +1). Significance is marked as *p < 0.05, **p < 0.01, ***p < 0.001 (two-sided). BMI: body mass index; PSS: perceived stress scale; DSH: daily sleep hours; WEH: weekly exercise hours; MS: metabolic syndrome; RUMI: rotating undergraduate medical internship; SBP: systolic blood pressure; DBP: diastolic blood pressure; HbA1c: glycated hemoglobin; TG: triglycerides; CHOL: total cholesterol; LDL: low-density lipoprotein; HDL: high-density lipoprotein; VLDL: very-low-density lipoprotein; MS: metabolic syndrome.
DSH was correlated with MS criteria (ρ = 0.491, p = 0.0092) in the pre-RUMI analysis and with weight at both time points (Pre: ρ = 0.486, p = 0.010; Post: ρ = 0.415, p = 0.031).
In the post-RUMI, PSS score was directly correlated with LDL (ρ = 0.765, p < 0.0001) and TG (ρ = 0.635, p = 0.0004) and inversely correlated with HDL (ρ = 0.533, p = 0.0042), suggesting an important role in lipid profile. As for clinical variables, weight inversely correlated with HDL (Post: ρ = -0.410, p = 0.0336), and BMI directly correlated with HbA1c (Post: ρ = 0.395, p = 0.0416), consistent with risk clustering, but noteworthy given the short follow-up.
DISCUSSION
Our study found changes in key metabolic measurements after just 1 year of RUMI. In continuous outcomes, we observed higher weight and BMI, modest but consistent increases in both SBP and DBP, and worsening glycemic markers (fasting glucose, HbA1c). In the lipid profile, HDL and CHOL rose while LDL showed no clear change and TG were largely stable. Categorical analyses corroborated these trends, finding a marked rise in prediabetes and MS prevalence. Correlations revealed noteworthy associations between perceived stress and an atherogenic lipid profile. Although these metabolic changes may be attributed to several variables, herein, we will focus on sleep deprivation, physical activity and stress as the measured factors in our population.
Sleep deprivation
In this cohort, a significant reduction in daily sleep time was observed (Δ = -1.96 [-2.10, -1.83], p < 0.01). Sleep deprivation is an inherent part of medical internships and is perhaps the single most pervasive stressor with multi-faceted metabolic effects8. Restricting sleep disrupts metabolism through cortisol elevation and activates the hypothalamic-pituitary-adrenal (HPA) axis inducing a pro-inflammatory state9, reducing insulin sensitivity10, and promoting endothelial dysfunction, which, over time, impairs the normal BP11.
Sleep deprivation is also related to leptin reduction and ghrelin increase which leads to hunger and craving for high calorie foods12. In fact, people who habitually sleep < 6 h tend to consume more calories (~300 kcal more/day) and have higher rates of weight gain and obesity than those who sleep for 7-8 h13.
Lipid metabolism is affected as well. Normally, triglyceride levels dip at night and peak after daytime meals; lack of sleep and nighttime eating can flatten or invert these rhythms14. Some studies report that a single night of total sleep deprivation can acutely raise free fatty acid levels and reduce next-day fatty acid clearance9. Over time, recurrent sleep loss might contribute to higher fasting TG and lower HDL, as it was appreciated here15.
Fortunately, many of these effects are reversible or mitigable; recovery sleep and “sleep hygiene” measures can restore normal hormone levels (e.g., bringing cortisol and ghrelin back to baseline). Strategic napping or catch-up sleep on days off may partly offset weekly sleep debt; one study found that those who managed weekend catch-up sleep had better insulin sensitivity than those who did not8.
Physical inactivity
Just like sleep time, exercise hours changed significantly after RUMI, with median WEH dramatically dropping from 3 (0-5) at baseline to 0 (-2.89 [-3.73, -2.04]) at follow-up. Reduced muscle activity lowers energy expenditure and worsens insulin sensitivity, favoring weight gain and glucose metabolism abnormalities16. In fact, a previous study among medical residents showed that physical inactivity favored overweight and obesity as training progressed, rosing from 30% in the 1st year to 49% by the 3rd year17.
Exercise is also related to lipid metabolism as it boosts lipoprotein lipase, which clears TG, and raises HDL levels16. Therefore, inactivity lowers HDL and raises LDL and TG, contributing to an atherogenic lipid profile15.
Psychological stress
Similar to sleep deprivation, chronic psychological stress activates the HPA axis and elevates cortisol levels18, promoting central fat deposition and increasing appetite by stimulating ghrelin production19.
Stress and MS have been closely related in several studies, either to higher BP20, visceral adiposity21, hyperglycemia and insulin resistance22, and lipid metabolism14. A previous meta-analysis found that individuals with higher perceived stress had significantly higher BMI, waist circumference, TG, and DBP than those with low stress, because stress stimulated lipolysis, releasing free fatty acids into circulation22. In this cohort, a close relation between the PSS-14 score with LDL and TG levels, as well as an inverse relation to HDL, was observed confirming this observation.
Besides this, stressed individuals are more susceptible to “stress-eating,” which directly lead to weight gain and dyslipidemia23. Indeed, college students with higher perceived stress report more unhealthy dietary habits23, being more propense to have overweight than low-stress peers24, reinforcing that psychological stress is a central driver of the MS development, and pointing out that stress-reduction interventions are fundamental not only to reduce stress scores, but to improve the metabolic profile of the medical trainees25.
Clinical implications
Medical trainees face extended shifts with sleep deprivation, physical inactivity, and high psychosocial stress that synergistically elevate their metabolic risk26. Our findings underscore an urgent need for comprehensive, hospital-based interventions to protect trainees’ metabolic health.
First, the continuous metabolic screening should be performed in order to provide preventive counseling or take actions about it27. As it has been probed in residents, the integration of a wellness program focused on mental health, sleep, and quality of life could mitigate fatigue and endocrine stress, improving global health28. This program should consider lunchtime hours with healthy options29, physical activity programs30, and dedicated psychological support31. Altogether, these interventions should be considered by health institutions not only to prevent MS in residents and interns but also to improve their overall performance, long-term health, and capacity to deliver optimal patient care.
Limitations and future work
There were some limitations in our study like the small sample size, single-center design, and lack of other confounding variables (as diet and PSS pre-RUMI), which limits precision and generalizability of our results. However, its prospective, paired, within-person design with cross-validated analyses enhances robustness, capturing real working conditions of interns in Mexico (population scarcely studied). Therefore, future work should be focused on multicenter and larger cohorts, using validated instruments at baseline and follow-up for diet, physical activity, sleep, and stress, and it should also consider interventional designs targeting sleep hygiene, healthy nutrition, physical activity, and stress management within hospital workflows.
CONCLUSION
In this paired cohort of medical interns, we observed consistent adverse changes post-internship across adiposity, BP, glycemia, and lipid profile, alongside a marked increase in prediabetes and MS. While exploratory and limited by sample size, these findings highlight the rapid metabolic impact of internship demands and support the need for targeted institutional strategies to mitigate cardiometabolic risk in medical trainees. Future controlled and mechanistic studies are warranted to confirm these associations and to evaluate comprehensive wellness interventions in this population.
ACKNOWLEDGMENTS
We would like to thank the Undergraduate Medical Interns who participated in this study and the staff of the Biochemistry department of the Benemérita Universidad Autónoma de Puebla for their assistance with sample processing and assays. We also thank the academic coordination of the Hospital Universitario de Puebla for facilitating logistics for the pre- and post-internship assessments.
FUNDING
The reagents used for this study were funded by the Benemérita Universidad Autónoma de Puebla; the remaining costs were covered by the researchers. No external funding was received.
CONFLICTS OF INTEREST
The authors declare that they have no conflicts of interest.
ETHICAL CONSIDERATIONS
Protection of humans and animals. The authors declare that no experiments involving humans or animals were conducted for this research.
Confidentiality, informed consent, and ethical approval. The authors have followed their institution’s confidentiality protocols, obtained informed consent from all participants, and secured approval from the Ethics Committee. SAGER guidelines have been followed as applicable to the nature of the study.
Declaration on the use of artificial intelligence. The authors declare that no generative artificial intelligence was used in the writing or creation of the content of this manuscript.
SUPPLEMENTARY DATA
Supplementary data is available at DOI: 10.24875/RME. 25000060. This data is provided by the corresponding author and published online for the benefit of the reader. The content of the supplementary data is the sole responsibility of the authors.
