
BACKGROUND
The prevalence of obesity in the Caribbean is one of the highest worldwide. Their related pathologies account for approximately three-quarters of global deaths1. The convergence of numerous socioeconomic and cultural factors has negatively affected dietary and physical activity patterns in the population of the region2. In general, obesity is easily identified by the onset of body alterations such as excess weight or abnormal fat accumulation in specific body areas3.
Most epidemiological surveys in the region evidence a trend toward increased obesity, though specific prevalence values seem to differ between different population groups2,4–14. Older adults appear at higher risk due to several age-associated pathologies that affect proper nutritional health and increase sedentary behavior15,16. Havana, with a population of 2 million people, is one of the largest urban centers in the Caribbean. Recent economic transformations have promoted better access to foreign food markets, leading to changes in dietary habits. This, together with its rapidly aging population, makes it an interesting place to study the public health implications of these nutritional and demographic transitions16.
How this new socioeconomic context is affecting the prevalence of obesity in the older adult population of the city remains to be explored. An updated view on the current epidemiology of obesity is needed for implementing better community-tailored public policies to tackle emergent trends. In this study, we explore the prevalence of obesity and central adiposity in urban-dwelling adults with ≥ 60 years in Havana and their sex and age-related distributions.
MATERIALS AND METHODS
A cross-sectional exploratory survey on overweight, obesity, and central adiposity was carried out in 2024 in the elderly urban population of Miramar, Havana. All participants gave their written consent. The survey complied with the Declaration of Helsinki on the protection of human subjects in research17 and was approved by the ethics committee of the University Clinic Ana Betancourt. The survey comprised two phases, which are described in figure 1.
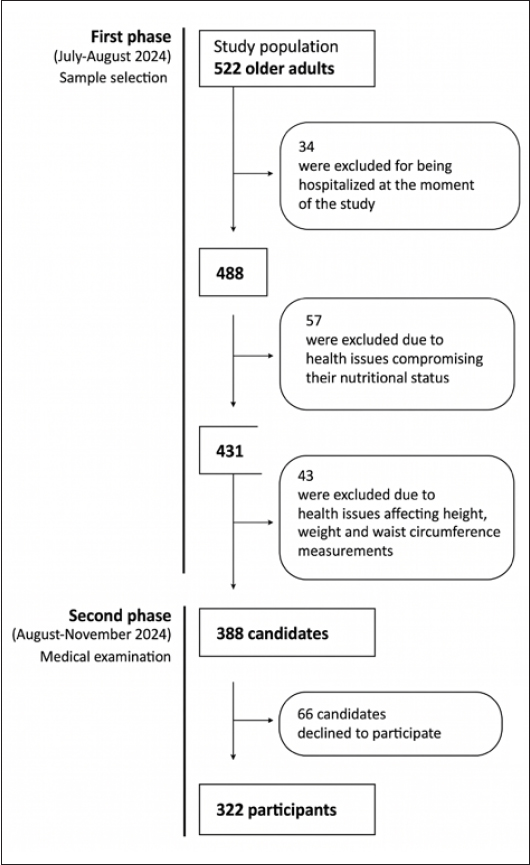
Figure 1. Flowchart of the study phases and sample selection.
In the first phase (July-August 2024), all available medical records of the 522 adults aged ≥ 60 years, residing in the district of Miramar in Havana and registered in the 8th family doctor´s office of the University Clinic Ana Betancourt were screened. Candidates were excluded if: (i) hospitalized (n = 34), (ii) had health issues compromising their nutritional status (e.g., diabetes, dysphagia, gastrointestinal pathologies, dementia, or cancer) (n = 57) or (iii) had comorbidities affecting height, weight, and waist circumference (e.g., lordosis, scoliosis, kyphosis, or abdominal mass) (n = 43). A total of 388 eligible candidates were identified.
In the second phase (August-November 2024), the selected candidates were contacted and invited to undergo anthropometric examination. Refusal rate was 17.0% (66 candidates declined to participate in the survey) and the final study sample included 322 older adults (183 females and 138 males). Height and weight measurements were collected using a stadiometer (Salus) and a scale (InBody H20N), respectively. Waist circumference was assessed using a flexible tape (Seca). Body mass index (BMI) values were calculated by dividing a person’s weight in kg by its height in m squared and expressed in kg/m2. Obesity was determined based on the World Health Organization (WHO)18 cut-offs (normal weight: 18.5-24.9 kg/m2; overweight: 25.0-29.9 kg/m2; obesity: 30.0-39.9 kg/m2; extreme obesity: ≥ 40.0 kg/m2). Central adiposity was assessed based on the American College of Cardiology/American Heart Association (ACC/AHA) criteria for waist circumference (males: ≥ 102 cm, females: ≥ 80 cm)19.
Data processing and analysis were carried out using the Statistical Package for the Social Sciences (IBM SPSS Statistics version 26). Mean and standard deviation (SD) values for height, weight, waist circumference, and BMI in the study sample were calculated. Prevalence values (%) of the different categories for nutritional status (normal weight, overweight, obesity, and extreme obesity) and central adiposity (normal and increased) were determined in the total sample and by sex (female and male) and age groups (60-69, 70-79, 80-89, and ≥ 90 years). Sex- and age-related prevalence variability of each category was evaluated by statistical comparisons using the X2 test (α = 0.05), as well as odds ratios (OR) estimations based on univariate logistic regression models.
RESULTS
Sample characteristics are displayed in table 1. Females and elders aged 60-79 years tended to be overrepresented in the study sample. Table 2 shows the prevalence and OR for overweight and obesity in the total sample and by sex and age groups. Overweight was common (41.9 %), and its prevalence tended to be higher in males (p = 0.20). Obesity was also frequent in the sample (17.4 %), but its prevalence tended to be higher in females (p = 0.72). Extreme obesity was rare, only 0.6% of the total sample. If combined, overweight and obese subjects represented 59.3% of the sample and had similar prevalence between sexes (p = 0.84).
Table 1. Sample characteristics
| Variable | Value |
|---|---|
| Sex, (%) | |
| Male | 42.9 |
| Female | 57.1 |
| Age (mean ± SD) | 74 ± 3.4 years |
| Age groups, (%) | |
| 60-69 years | 37.7 |
| 70-79 years | 31.9 |
| 80-89 years | 20.2 |
| ≥ 90 years | 10.2 |
| Height (mean ± SD) | 163.3 ± 11.3 cm |
| Weight (mean ± SD) | 71.7 ± 15.6 kg |
| Waist (mean ± SD) | 96.2 ± 8.7 cm |
| BMI (mean ± SD) | 26.8 ± 4.4 kg/m2 |
|
SD: standard deviation. |
|
Table 2. Prevalence and OR for overweight and obesity in total sample and by sex and age groups
| Nutritional status | Age group (years) | Total | OR | 95% CI | Males | OR | 95% CI | Females | OR | 95% CI | |||
|---|---|---|---|---|---|---|---|---|---|---|---|---|---|
| n | % | n | % | n | % | ||||||||
| NW | All | 131 | 40.7 | – | – | 54 | 39.1 | – | – | 77 | 41.8 | – | – |
| 60-69 | 36 | 30.5 | – | – | 16 | 28.6 | – | – | 20 | 32.3 | – | – | |
| 70-79 | 28 | 28.0 | – | – | 8 | 22.9 | – | – | 20 | 30.8 | – | – | |
| 80-89 | 33 | 52.4 | – | – | 11 | 42.3 | – | – | 22 | 48.9 | – | – | |
| ≥ 90 | 34 | 80.5 | – | – | 19 | 83.3 | – | – | 15 | 75.0 | – | – | |
| OOab | All | 191 | 59.3 | – | – | 84 | 60.9 | 1.0 | Ref. | 107 | 58.2 | 0.9 | 0.7, 1.1 |
| 60-69 | 82 | 69.5 | 1.0 | Ref. | 40 | 71.4 | 1.0 | Ref. | 42 | 67.7 | 1.0 | Ref. | |
| 70-79 | 72 | 72.0 | 1.1 | 0.8, 1.2 | 27 | 77.1 | 1.0 | 0.7, 1.2 | 45 | 69.2 | 1.0 | 0.6, 1.3 | |
| 80-89 | 30 | 47.6 | 0.8 | 0.6, 1.4 | 15 | 57.7 | 0.9 | 0.8, 1.5 | 15 | 51.1 | 0.8 | 0.4, 1.5 | |
| ≥ 90 | 7 | 19.5 | 0.3 | 0.1, 0.5 | 2 | 16.7 | 0.2 | 0.1, 1.0 | 5 | 25.0 | 0.5 | 0.1, 0.9 | |
| OWab | All | 139 | 41.9 | – | – | 67 | 48.6 | 1.0 | Ref. | 72 | 39.1 | 0.8 | 0.6, 1.0 |
| 60-69 | 60 | 50.9 | 1.0 | Ref. | 32 | 57.1 | 1.0 | Ref. | 28 | 45.2 | 1.0 | Ref. | |
| 70-79 | 48 | 48.0 | 1.0 | 0.8, 1.3 | 20 | 59.1 | 1.0 | 0.8, 1.1 | 28 | 43.0 | 1.0 | 0.7, 1.2 | |
| 80-89 | 24 | 38.1 | 0.9 | 0.7, 1.5 | 13 | 50.0 | 1.0 | 0.7, 1.1 | 11 | 29.7 | 0.8 | 0.5, 1.4 | |
| ≥ 90 | 7 | 19.5 | 0.4 | 0.2, 0.9 | 2 | 16.7 | 0.3 | 0.1, 0.7 | 5 | 25.0 | 0.7 | 0.8, 1.2 | |
| OBab | All | 52 | 17.4 | – | – | 17 | 12.3 | 1.0 | Ref. | 35 | 19.1 | 1.2 | 0.7, 1.7 |
| 60-69 | 22 | 18.6 | 1.0 | Ref. | 8 | 14.3 | 1.0 | Ref. | 14 | 22.6 | 1.0 | Ref. | |
| 70-79 | 24 | 24.0 | 1.1 | 0.5, 2.2 | 7 | 18.0 | 1.1 | 0.7, 1.5 | 17 | 26.2 | 1.0 | 0.7, 1.5 | |
| 80-89 | 6 | 9.5 | 0.5 | 0.3, 1.0 | 2 | 7.7 | 0.5 | 0.1, 0.5 | 4 | 10.8 | 0.6 | 0.4, 0.9 | |
| ≥ 90 | 0 | 0.0 | – | – | 0 | 0.0 | – | – | 0 | 0.0 | – | – | |
|
Cells in bold indicate statistically significant OR, Ref.: reference category. aNo significant difference across sex groups. bSignificant difference across age groups in total sample, in males and females. NW: normal weight; OO: combined overweight/obesity; OW: overweight; OB: obesity. |
|||||||||||||
Significant variations across age groups were detected for overweight (p = 0.01) and obesity (p = 0.04) in the sample. Overall, participants aged 60-79 years consistently showed the highest prevalence of overweight and obesity, whereas those with ≥ 80 years presented the lowest values. However, age-related variability of overweight and obesity differed when analyzing their distribution across the 10-year cohorts (60-69, 70-79, 80-89, and ≥ 90 years). Overweight prevalence tended to plateau in older adults aged 60-69 and 70-79 years with values exceeding 40%, declined slightly in the 80-89 years group, and reached the lowest value in subjects aged ≥ 90 years. Meanwhile, obesity prevalence seems to reach a peak in the 70-79-year cohort, sharply decline in the 80-89 years group, and does not appear among subjects aged ≥ 90 years. These distributions were consistent in both males (overweight: p = 0.03, obesity: p = 0.02) and females (overweight: p = 0.04; obesity: p = 0.02), when analyzed separately. OR values reflected similar patterns and suggest that overweight was more likely in males and participants aged 60-69 years, whereas obesity tended to be more likely in females and in participants aged 70-79 years.
Table 3 shows the prevalence and OR for central adiposity in total sample and by sex and age groups. In the total sample, central adiposity was common (24.2 %), significantly higher in females (p = 0.02) and tended to be more frequent in subjects aged 70-79 years (p = 0.55). However, its age-related variability appeared to be substantially affected by sex. In males, significant differences were detected (p = 0.04) with prevalence reaching its highest value in the 70-79-year group to sharply decline with advanced age (80-89 and ≥ 90 years). Conversely, in females, observed variations were not significant (p = 0.47) and prevalence tended to be higher in the 60-69 years cohort and to decline steadily with advanced age. OR estimations indicated that elders with 70-79 years were more likely to show increased central adiposity among males, whereas the 60-69 years group showed the highest risk among females.
Table 3. Prevalence and OR values for central adiposity in total sample and by sex and age groups
| Central adiposity | Age group (years) | Total | OR | 95% CI | Males | OR | 95% CI | Females | OR | 95% CI | |||
|---|---|---|---|---|---|---|---|---|---|---|---|---|---|
| n | % | n | % | n | % | ||||||||
| NA | All | 227 | 75.8 | – | – | 113 | 81.9 | – | – | 114 | 61.9 | – | – |
| 60-69 | 79 | 79.7 | – | – | 46 | 82.1 | – | – | 33 | 53.2 | – | – | |
| 70-79 | 63 | 70.0 | – | – | 23 | 65.7 | – | – | 40 | 61.5 | – | – | |
| 80-89 | 48 | 76.2 | – | – | 23 | 88.5 | – | – | 25 | 67.6 | – | – | |
| ≥ 90 | 37 | 90.2 | – | – | 21 | 100.0 | – | – | 16 | 80.0 | – | – | |
| IAab | All | 95 | 24.2 | – | – | 25 | 18.1 | 1.0 | Ref. | 70 | 38.1 | 1.3 | 0.9, 2.1 |
| 60-69 | 39 | 20.3 | 1.0 | Ref. | 10 | 17.9 | 1.0 | Ref. | 29 | 46.8 | 1.0 | Ref. | |
| 70-79 | 37 | 30.0 | 1.2 | 0.8, 1.6 | 12 | 34.3 | 1.4 | 0.6, 2.6 | 25 | 38.5 | 1.0 | 0.8, 2.1 | |
| 80-89 | 15 | 23.8 | 1.0 | 0.7, 1.4 | 3 | 11.5 | 0.9 | 0.5, 1.2 | 12 | 32.4 | 0.9 | 0.7, 1.9 | |
| ≥ 90 | 4 | 9.8 | 0.6 | 0.2, 1.1 | 0 | 0.0 | – | – | 4 | 20.0 | 0.5 | 0.3, 1.3 | |
|
Cells in bold indicate statistically significant OR, Ref.: reference category. aSignificantly higher in females. bSignificant difference across age groups in total sample, in males or females. NA: normal adiposity, IA: increased adiposity. |
|||||||||||||
DISCUSSION
Body fat is affected by several genetic, physiological, behavioral, and socioeconomic factors. Their distinctive combinations have shown to differentially impact a person´s anthropometry and likelihood of obesity and central adiposity, as well as their possible variations with advanced age2. Sex-specific differences in body fat distribution in adult bodies have been widely described (males: higher visceral/abdominal fat, females: higher subcutaneous fat) and are often incorporated by anthropometric criteria for diagnosis of obesity and central adiposity3,20–22. In adult populations of Hispanic origin, most studies consistently show higher prevalence of obesity in females but higher central adiposity in males1–3,4–8,10–14.
However, in adults aged ≥ 60 years, weight changes are recurrent and miscellaneous23. Particularly in elderly females, the loss of estrogens after menopause has shown to be associated with increased central adiposity24. Major changes in body composition with advanced age include: (i) increased overall adiposity, (ii) increased ectopic fat infiltration, and (iii) loss of skeletal muscles20–24. In general, body weight and BMI of healthy adults increase with age, reach an intermediate period of stability around 75 years old, and later decline21. The overall sex- and age-related variability for obesity and central adiposity observed in our study sample is coherent with previously described trends4–6,20–24.
Furthermore, we believe that other socioeconomic factors may also constitute possible causes for detected trends, particularly those affecting physical activity levels25. Among the elderly of Miramar, “active” routines are often replaced by sedentary behaviors after retired (e.g., screen-time and day-naps). Furthermore, under current Cuban law, males and females are eligible for pension funds at different ages (65 and 60 years, respectively). These differences in retirement age may favor the emergence of obesogenic lifestyles earlier in females of Miramar and contribute to their higher prevalence of obesity and central adiposity.
Regardless of their sex- and age-related variability, the prevalence of obesity and central adiposity in older Cubans from Miramar in 2024 was considerable. As shown in figure 2, the observed values correspond to the highest reported in urban elderly of Havana to date4,5. They suggest that the upward trend of obesity in older adults could be an ongoing phenomenon and could be evidence of current public health policies limitations to tackle its proliferation.
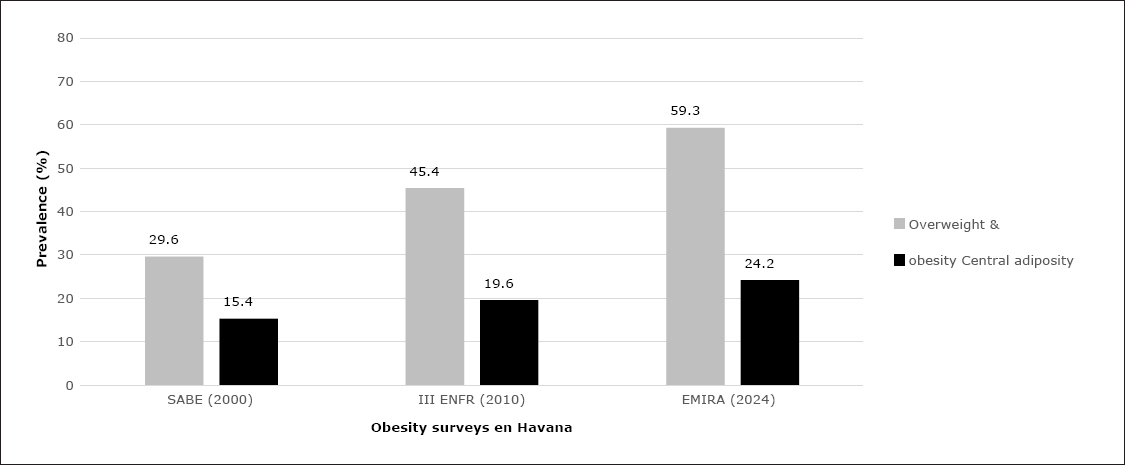
Figure 2. Prevalence of combined overweight/obesity (grey) and central adiposity (black) in older adults of Havana reported by recent surveys. SABE: Health, Well-Being, and Aging survey; III ENFR: III Encuesta Nacional de Factores de Riesgo de Cuba; EMIRA: Envejecimiento en Miramar.
Major socioeconomic transformations have occurred in the last decade and should be addressed by policymakers. Food availability and dietary diversity in Havana have undergone radical changes, with traditional foods (low in complex carbohydrates) progressively replaced by industrial processed foods (rich in saturated fat and refined carbohydrates)26. Moreover, COVID-19 containment policies and their long-lasting effects on the lifestyles of urban-dwelling elderly populations should not be disregarded. Intensive risk awareness campaigns had resulted in widespread shifts of physical activity patterns, particularly during recreational time27. Their pre-pandemic activities often included urban tourism, social outings, group exercises, and sports events. Conversely, their post-pandemic recreational activities are predominantly sedentary (e.g., watching television and cell screens). In this new socioeconomic context, emergent dietary and physical activity patterns are more likely to promote overweight/obesity.
Obesity studies in the Caribbean, while numerous, show a considerable heterogeneity in methodology and sample composition. Therefore, comparative analysis with regional data is limited. In general, our findings are coherent with ongoing nutritional transitions occurring in the region1,2,4–14. The prevalence of obesity and central adiposity reported in different Caribbean adult populations is presented in figure 3. A pooled analysis of several population studies published by the Non-communicable Disease Risk Factor Collaboration (NCD-RisC)1 showed an upward trend for obesity in the Caribbean. As shown in figure 3A, regional estimations of obesity in adults (≥ 20 years) in 2022 were substantial, with most territories showing values ≥ 30%. Notably, not all countries showed the same epidemiological dynamics. The United States of America, The Bahamas, Belize, Barbados, and Saint Kitts and Nevis presented values above 50%, whereas Cuba and Haiti were estimated to have the lowest (20 to 25%) (Fig. 3A). However, these estimations in adults (≥ 20 years) may differ from those recorded in elderly populations (≥ 60 years).
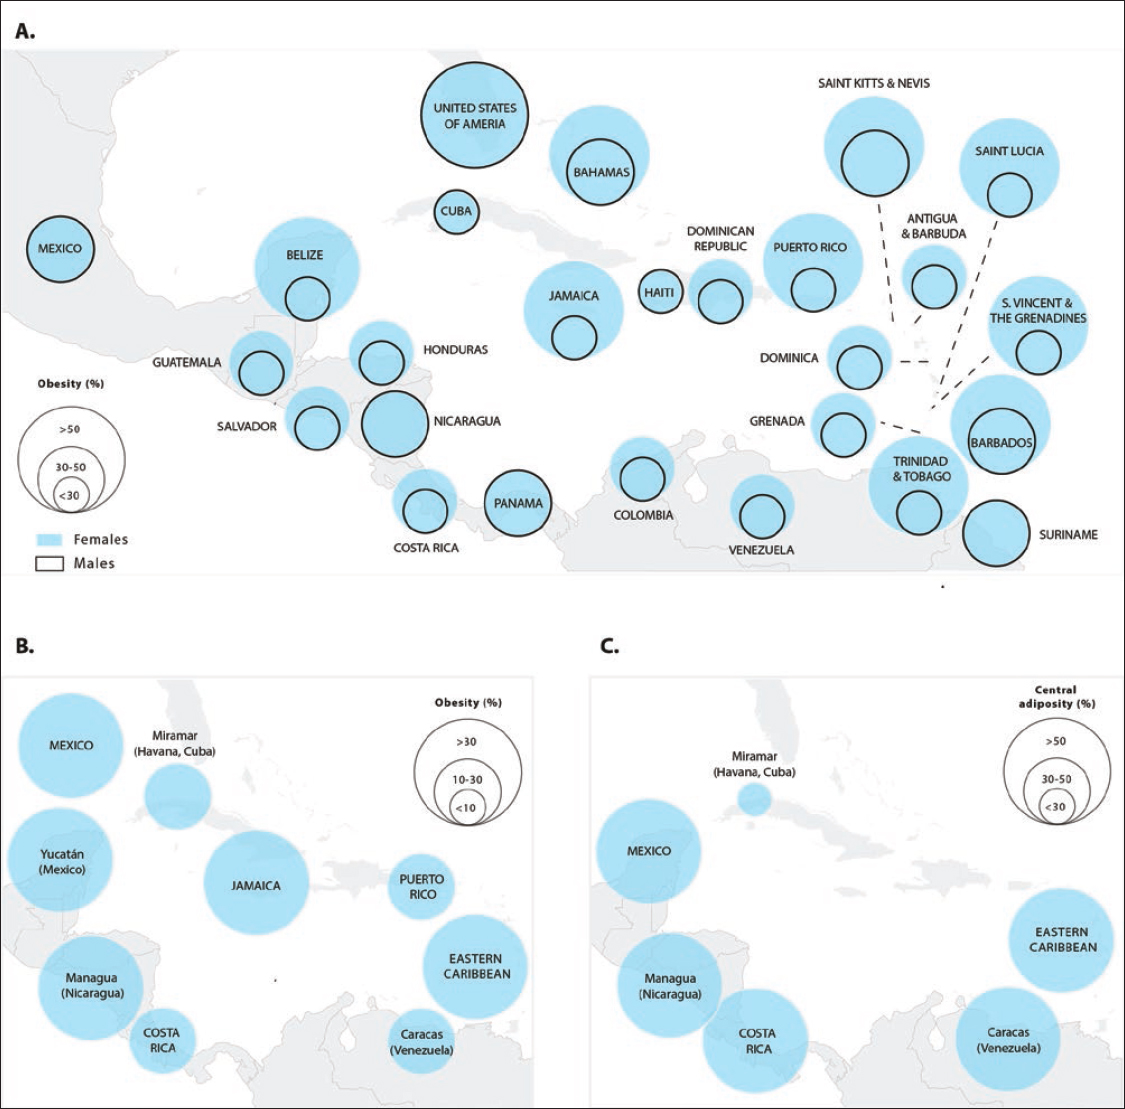
Figure 3. Obesity and central adiposity across the Caribbean. A: obesity in adults aged ≥ 20. B: obesity in urban-dwelling older adults (≥ 60 years). C: central adiposity in urban-dwelling older adults (≥ 60 years). Data corresponding to nation-wide samples are presented in capital letters and those corresponding to specific urban areas are identified in lowercase letters.
Available academic literature published within the 2020-2025 time-period suggests that obesity surveys on urban elderly samples are sparse and their results are highly variable7–14. As presented in figure 3B, obesity in older adults of Miramar (17.4 %) was smaller compared to values recorded in urban areas of Mexico (Mexico: 35.6 %; Yucatán: 43.0 %)7,8, Jamaica (34.0 %)9, Venezuela (Caracas: 25.0 %)10, Puerto Rico (26.5-29.5 %)11, Eastern Caribbean (37.9 %)12, and Nicaragua (Managua: 46.0 %)14. Only populations in Costa Rica (Obesity: 12.9%)13 seem to show smaller values than those detected in our sample (Fig. 3B). Meanwhile, as illustrated figure 3C, central adiposity in the elderly of Miramar (24.2 %) was considerable smaller compared to previous records in urban areas of Mexico (91.1%)7, Nicaragua (76.0 %)14, Venezuela (Caracas: 70.0 %)10, Costa Rica (68.7 %)13, and Eastern Caribbean (47.9 %)12 (Fig. 3C).
Despite the increasing prevalence of obesity and central adiposity in older adult populations of Havana4,5, detected values remain among the lowest in the Caribbean region4–14. However, if not curved, the current upward trend will likely lead to a future epidemiological context where obesity and its related pathologies may pose a greater challenge for the public health system. Emergent socioeconomic and lifestyle factors underlying the recent increase in obesity in urban populations of Cuba need to be identified and tackled. We believe that the current demographic, epidemiological, and socioeconomic context in Miramar has reached a pivotal point and may serve as an opportunity for the implementation of new community-tailored public health policies. Presented data indicate that obesity should be addressed as a public health emergency in both Cuba and the Caribbean.
CONTRIBUTIONS AND LIMITATIONS
Up-to-date information on sex- and age-specific distributions of overweight, obesity, and central adiposity in older adults of Miramar is provided. Exposed trends and analysis may offer new insights into their current epidemiology, particularly in an urban context of Havana -Cuba- under rapid demographic aging and socioeconomic transformations. In addition, our data may serve as a reference for future studies as well as for the development of locally tailored public health policies aiming to tackle increasing obesity.
Major limitations of this research stem from its methodological design, as well as the characteristics of the study sample. Its cross-sectional exploratory nature does not provide information on individual changes in health trajectories and their possible associations with BMI, waist circumference, or socioeconomic factors. The study sample size and composition restrict further analysis and generalizations of observed trends. Miramar is one of many urban districts of Havana and serves as home to a population with distinct socioeconomic characteristics and thus should not be generalized. Obesity in elderly Cubans, its sex- and age-specific prevalence and possible relationship with mortality, fragility, and life quality in a wider local and national context remain to be explored.
CONCLUSION
Our findings suggest that obesity is a growing public health problem in older adults of Miramar, Havana. Notably, both obesity and central adiposity tend to show sex- and age-specific distribution. Obesity was highest in both males and females aged 70-79 years, whereas central adiposity was highest in males aged 70-79 years but in females aged 60-69 years. Overall, our records indicate that, regardless of sex, obesity and central adiposity are higher in the 60-79-year cohorts. Our data indicate that increasing obesity and central adiposity prevalence in older adults of Miramar, if not tackled, can constitute a public health emergency and that new policies should be adjusted by sex and age groups.
FUNDING
This research has not received any specific grant from agencies in the public, commercial, or for-profit sectors.
CONFLICTS OF INTEREST
The authors declare no conflicts of interest.
ETHICAL DISCLOSURES
Protection of humans and animals. The authors declare to have followed the ethical standards of the relevant experimentation committee, according to the World Medical Association and the Declaration of Helsinki. The procedures were approved by the institutional Ethics Committee.
Confidentiality, informed consent, and ethical approval. The authors have followed their institution’s confidentiality protocols, obtained informed consent from all patients, and secured approval from the Ethics Committee. SAGER guidelines have been followed as applicable to the nature of the study.
Declaration on the use of artificial intelligence. The authors declare that no generative artificial intelligence was used in the writing or creation of the content of this manuscript.
